


The black market for stolen car parts is a significant problem, exacerbated by the rise of online marketplaces like Craigslist or OfferUp, where stolen goods are often sold under the radar. In response to this growing issue, our research team at Baylor University has been leveraging cutting-edge AI techniques to detect patterns in car part sales that could signal illicit activity. This work is part of the NSF-funded Research Experiences for Undergraduates (REU) program, which provides undergraduate students with hands-on research experience in critical areas like artificial intelligence. Our project, supported by NSF Grant #2210091, investigates the potential of deep learning models to analyze vast amounts of data from online listings, offering a new tool in the fight against stolen car parts.
Why This Research Matters
The theft and resale of car parts not only affect vehicle owners but also contribute to organized crime. Detecting patterns in how stolen parts are sold online can help law enforcement track and dismantle these criminal networks. This project also presents a unique challenge to the AI research community: the complexity of analyzing unstructured, noisy data from real-world platforms. By utilizing the Vision Transformer (ViT) for image analysis, our research offers a different approach compared to previous works that employed multimodal models like ImageBind and OpenFlamingo.
Dataset and Embedding Extraction
Our dataset comprises thousands of car parts advertisements scraped from Craigslist and OfferUp, each including images and textual descriptions. To process the image data, we used the Vision Transformer (ViT), a model pre-trained on ImageNet-21k. ViT processes images by splitting them into 16×16-pixel patches, allowing for the extraction of key features from each image. These features were converted into embeddings—high-dimensional vectors that represent each image’s content in a form that the model can analyze.
We extracted embeddings for nearly 85,000 images, which were then compiled into a CSV file for further analysis, including clustering and visualization. Unlike prior works by Hamara & Rivas (2024) and Rashid & Rivas (2024), which utilized multimodal models like ImageBind and OpenFlamingo to fuse image and text data, we focused solely on image embeddings in this phase to assess the effectiveness of ViT in capturing visual patterns related to illicit activities.
Clustering and Evaluation
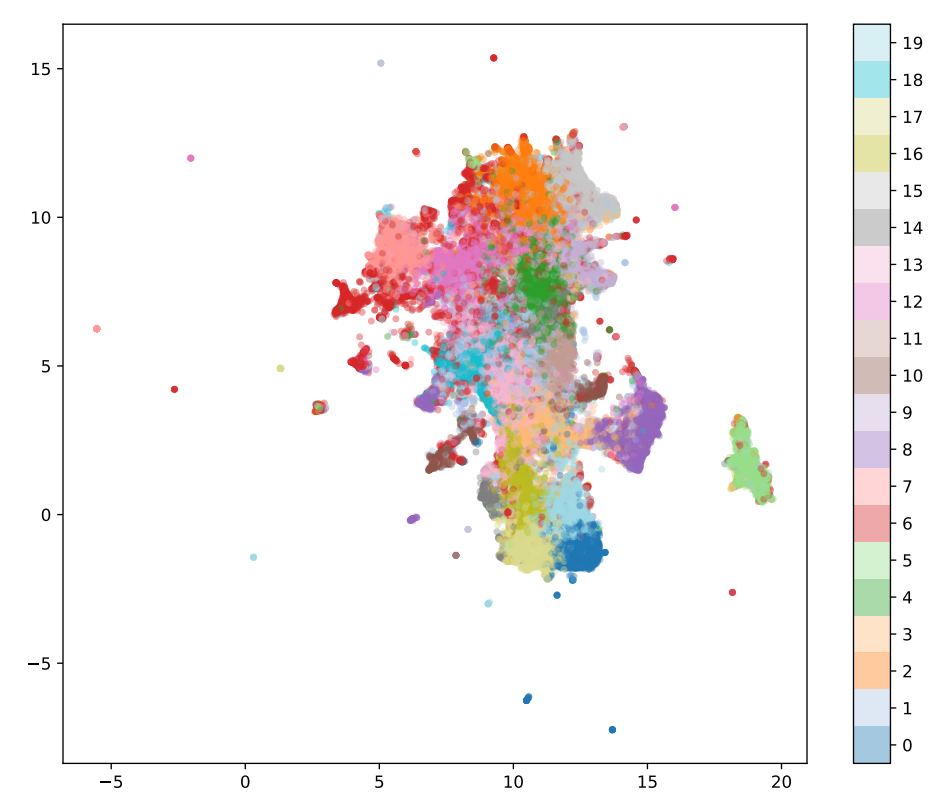
With the embeddings extracted, we used UMAP (Uniform Manifold Approximation and Projection) to project the high-dimensional data into a more interpretable 2D space for visualization. We then applied K-Means clustering, a widely used algorithm for grouping data, and experimented with different embedding dimensions—16, 32, 64, and 128—to identify the optimal number of clusters.
Among these, 64 dimensions proved to be the best suited for our dataset, as determined by three key clustering performance metrics:
- Silhouette Score: Measures how similar an object is to its own cluster compared to other clusters. A value of 0.015 indicated that some clusters were poorly defined.
- Calinski-Harabasz Index: Evaluates the variance ratio between clusters versus within clusters.
- Davies-Bouldin Index: Measures the average similarity between each cluster and its most similar cluster.
Although 128 dimensions performed well in some tests, 64 dimensions provided the clearest balance between cluster purity and computational efficiency. The low silhouette score, while indicating some overlap between clusters, helped confirm that most clusters were well-defined, despite several outliers—posts that displayed mixed or unclear features, such as images showing both powertrains and vehicle exteriors.
Findings and Analysis
Using the K-Means algorithm, we identified 20 distinct clusters, each representing different categories of car parts. Here are some key findings:
- Cluster 0: Primarily contained exterior shots of full vehicles.
- Cluster 1: Featured exterior components like mirrors and bumpers.
- Cluster 2: Focused on powertrain parts such as engines and transmissions.
- Cluster 3: Showcased body panels including doors, trunks, and hoods.
- Cluster 4: Grouped images of towing accessories like trailer hitches.
After clustering, we applied K-Nearest Neighbors (KNN) to identify the top 10 posts nearest to each cluster centroid, which allowed us to analyze representative posts and confirm the coherence of each cluster. Despite the general success of this approach, outliers emerged in the UMAP visualization, indicating the need for further refinement to handle posts with mixed features. This challenge is common in image analysis, particularly when models rely solely on visual data without the contextual information that multimodal models can provide.
Comparative Analysis with Prior Work
Our approach contrasts with that of Hamara & Rivas (2024) and Rashid & Rivas (2024), who utilized multimodal models like ImageBind and OpenFlamingo to integrate image and text data for enhanced analysis. While their methods leveraged the fusion of multiple data types to capture richer context, we aimed to assess the capabilities of ViT in isolating visual patterns indicative of illicit activity. This comparison highlights the trade-offs between focusing on single-modality models versus multimodal approaches in detecting complex patterns within unstructured data.
Broader Impact
This research demonstrates the potential of AI in analyzing large, unstructured datasets from online marketplaces, providing law enforcement with new tools to monitor and track stolen car parts. From a technical perspective, our project highlights the effectiveness of using ViT for image analysis in this context. As we continue refining our models and consider integrating multimodal approaches inspired by prior work, our collaboration with crosdisciplinary partners will ensure that this system becomes a valuable tool for combating the sale of stolen goods online.
As stated previously, the silhouette score for the dataset proved to be notably small, which was supported by the visualization containing numerous outliers. This may be attributed to clusters lacking clear definition, meaning that several posts contained images without many distinguishable features. This is understandable considering that while clusters emphasized a focus on specific car parts, many images still displayed various other vehicle components. For instance, although Cluster 2 primarily featured images of powertrains, the posts in this cluster also included shots of the exterior and body panels of the vehicle. This is logical as sellers often aim to showcase multiple facets of the vehicle when listing it, explaining the lack of focus on specific car parts.
About the Author
Cameron Armijo is a Computer Science undergraduate student at Baylor University, specializing in data mining.